Seattle Crime Trends and Spatial Distribution Analysis
The original collaborative submission that providing detailed insights into the design choices for each graph encodings, and the Python codes with comments could be found in: Github Repository.
Goal:
The central aim of this analysis is to conduct an investigation into the transformation of crime in Seattle over time while discerning its geographical distribution across various levels of zoning areas. The report seeks to reveal patterns and trends that illustrate the dynamics of criminal activity within the city, extending its focus to smaller communities for a more detailed understanding of the most vulnerable areas by crimes.
Key Insights
- Over time, there’s been an approximate 16% increase in Seattle’s overall crime rate.
- Predominant crime categories include Theft, Assault, and Burglary, collectively constituting 65% of the city’s total crime.
- The Downtown area of Seattle emerges as the most susceptible to crime, considering both the volume of incidents and the density of crimes.
- A specific high-risk zone has been identified within Seattle Downtown, confined by 2nd & 3rd Ave and Pike & Union St, showcasing the highest crime rates.
Technologies:
Python was selected as the primary programming language due to its versatility and the rich ecosystem of data analysis libraries:
- Pandas and Numpy for basic data preprocessing and analysis.
- Altair was utilized for its sophisticated visualization capabilities, and the ability for more encoding control.
- GeoPandas was employed for its powerful geospatial data processing abilities, facilitating efficient manipulation and analysis of geographical data.
- Folium was chosen for its proficiency in rendering interactive maps.
Data Introduction and Preparation:
The analysis relies on crime data acquired from the Seattle Police Department, covering the period from 2008 to 2022. Each crime report is uniquely identified by a Report Number, and are categorized by both specific Offense Types and broader Offense Parent Groups. Notably, due to the granularity of Offense Types, the report opts for Offense Parent Groups to streamline the crime classification.
Each incident is associated with start time, end time, and report time, with a preference for using the reported time for filtering as incidents are considered finalized at that point. Additionally, incidents are geographically tagged with coordinates and various location identifiers such as police precincts, beats, and sectors. To ensure public understanding, the analysis utilizes Community Reporting Areas (CRAs) in Seattle, which delineate neighborhoods and neighborhood districts,providing a more accessible language. These CRAs aggregate smaller zoning areas like Census tracts and blocks, ensuring precise reporting without overlaps. Data from the Census Bureau are pulled in for these smaller area characteristics and geometry.
The incident coordinates undergo transformation into Geometry point objects, facilitating a spatial join technique to determine the larger zoning areas to which each point belongs. Subsequently, a merger is conducted with the “Selected Demographic and Housing Estimates (DP05)” data for the year 2020, incorporating geo spatial population information. The combination of crime patterns with demographic factors provides valuable insights, enriching the understanding of the socio-economic landscape in Seattle.
All datasets are listed in References.
Insights:
Seattle Crime Dynamics: Crime Trends Over the Period 2008-2022
Examining the data from 2009 to 2022 reveals a noteworthy upward trend in overall crime in Seattle. 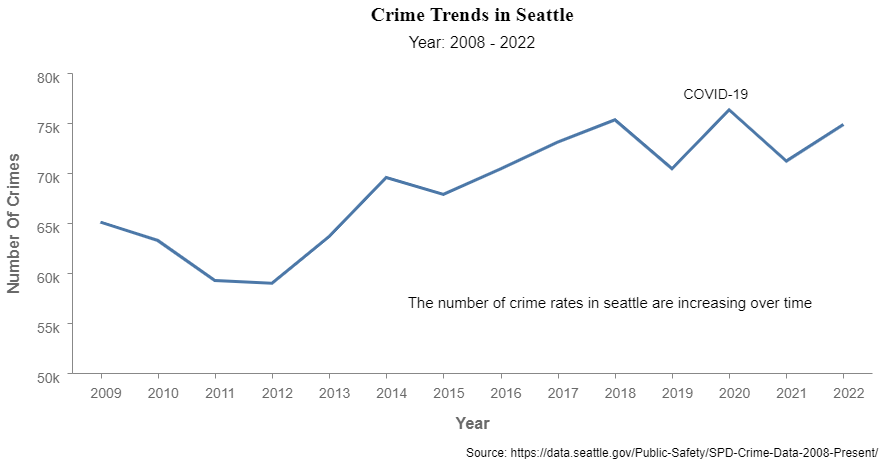
Although crime rates experienced a dip from 2008 to 2012, decreasing from 65,000 to just under 60,000, they consistently rose, peaking at around 76,000 in 2020 and maintaining levels above 70,000 through 2022.
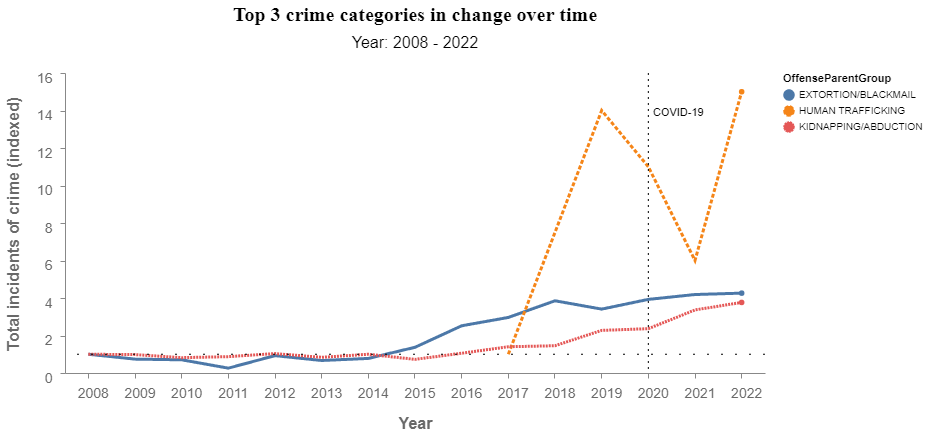
During this period, the top three crimes with the most significant increases were extortion/blackmail, human trafficking, and kidnapping/abduction, exhibiting growth rates of 326%, 276%, and 1,400%, respectively. Despite these seemingly rapid changes, the absolute numbers of these crimes remain relatively insignificant compared to other crime categories. Extortion/blackmail increased from 27 to 115 cases over 13 years, while kidnapping/abduction grew from 55 to 207 cases. Human trafficking, first reported in Seattle in 2018, consistently reported cases below 15 annually.
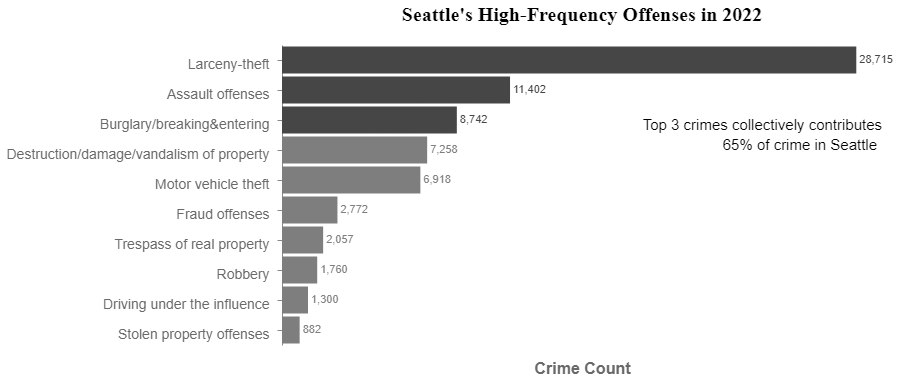
Interestingly, these high-growth categories do not make the top 10 list of popular crimes in Seattle. The most frequently committed crime in 2022 is Larceny/Theft, accounting for 24,115 cases and contributing to more than a third of all crimes in Seattle. Following closely are Assault and Burglary, with 11,402 and 8,742 cases, respectively. Collectively, these top three crimes out of all 31 crimes, contribute to 65% of all reported incidents.
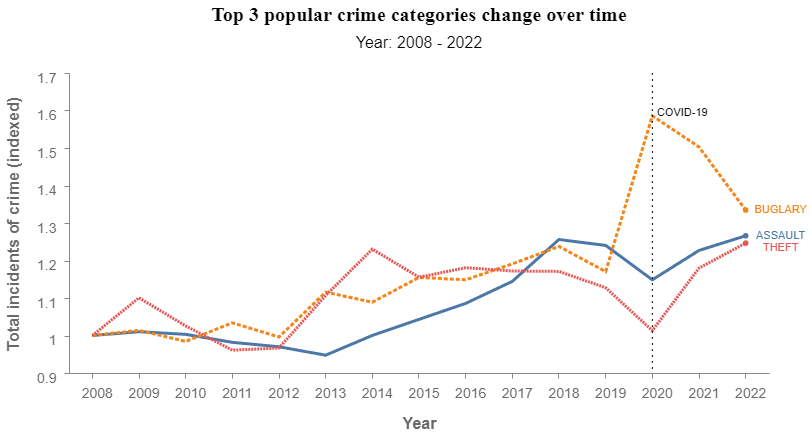
While these three major crimes grew over 24% during the analyzed period, they followed distinct trajectories. Until 2018, they fluctuated with upward trends, after which Larceny/Theft returned to approximately the same level as in 2008 in 2020. Assault cases experienced a drop from a 25% increase to a 15% increase in the same period. Notably, Burglary surged significantly in 2020, from 17% increase rate to 50%, and maintained a high count, cooling down to a 33% in 2022.
In summary, the overall crime rate in Seattle increased by approximately 15% over the 13-year period, averaging around 1.15% per year. The fastest-growing crime was human trafficking, reported since 2018, showing a remarkable 1,400% increase from one annual case to 15 annual cases. The most frequently committed crimes in Seattle—Theft, Assault, and Burglary—account for 65% of all incidents, with a collective increase of more than 25% over the specified time frame. Notably, during the year of the COVID-19 pandemic, Theft cases mirrored the initial period, while Burglary experienced a sudden 30% surge.
Identifying Seattle’s Most Vulnerable Neighborhood
Zoning areas like Census tracts and blocks change the borders based on their current population. Therefore, the report would only use the data of 2022 to compares between neighborhoods to allign with latest border changes.
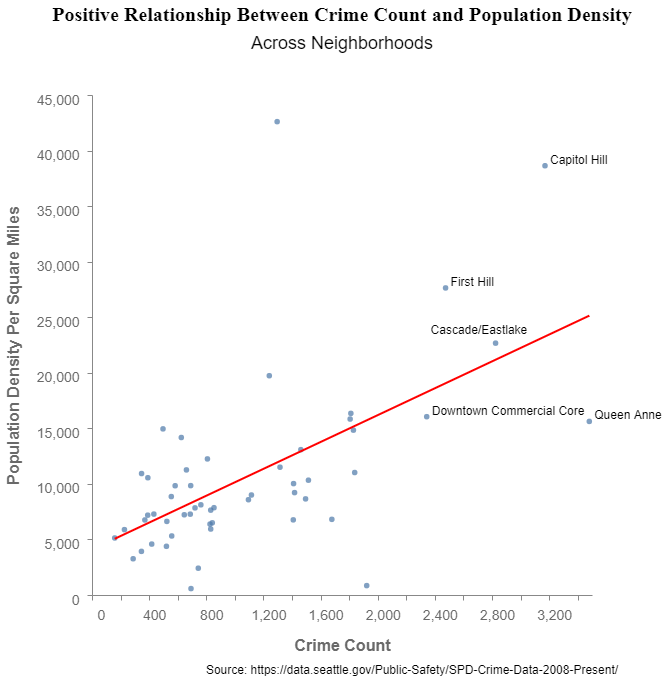
To pinpoint Seattle’s most precarious neighborhood, we begin by examining the potential relationship between crime rate and population density. Figure 5 illustrates a conceivable positive correlation, indicating that highly dense neighborhoods are more prone to witnessing increased crime incidents.
Moving to Figure 6, a choropleth map showcases crime rates across Seattle neighborhoods in 2022. Concentrations of higher crime are observed around the middle part of Seattle, particularly surrounding Downtown. Notably, Queen Anne and Capitol Hill emerge as neighborhoods with the highest crime counts. 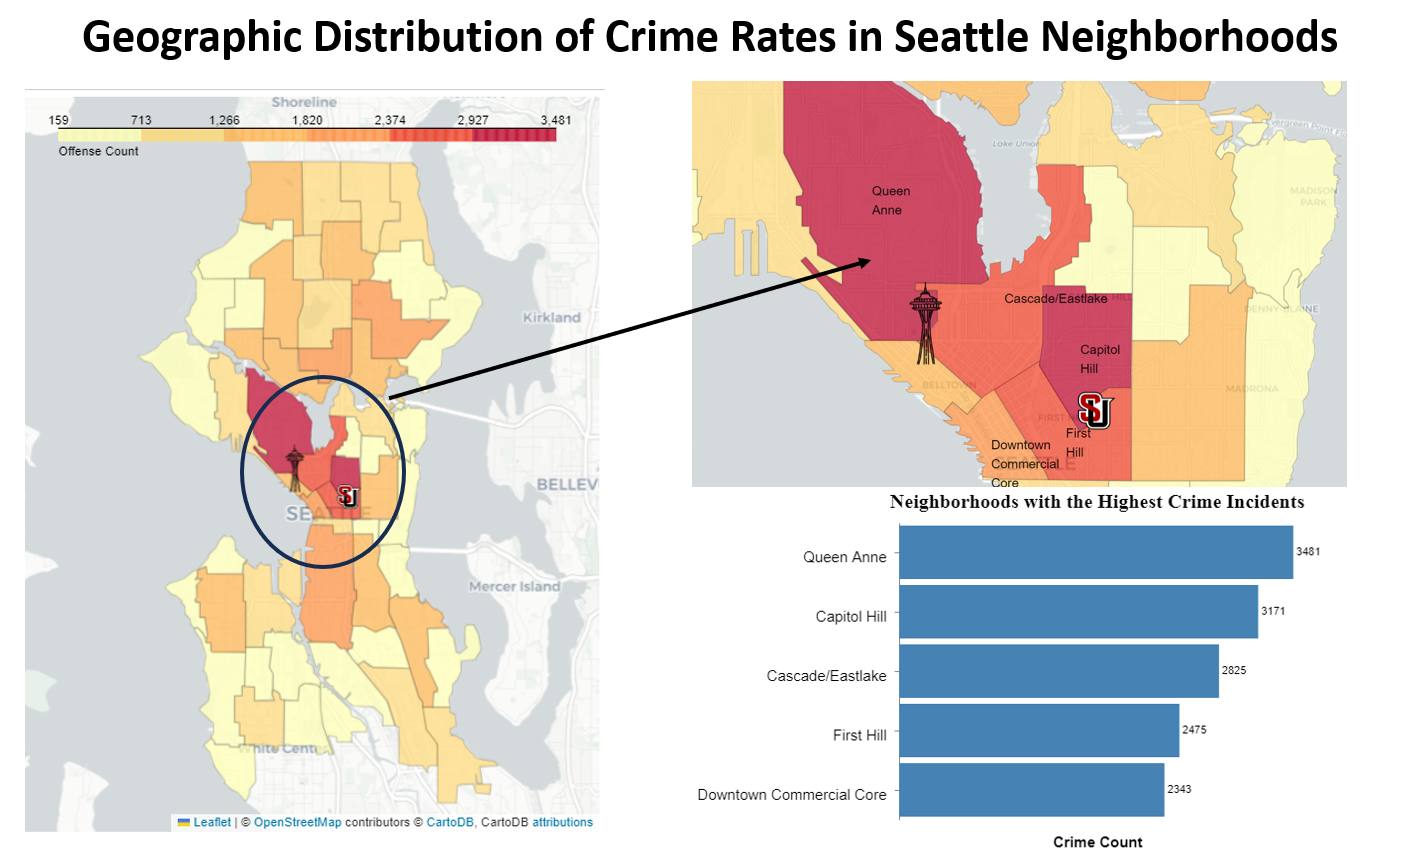
Figure 6 presents a choropleth map illustrating crime rates across Seattle neighborhoods in 2022. The color scale ranges from yellow to red, with red indicating higher crime rates, aligning with the common perception of red as a symbol of danger. The concentration of high crime neighborhoods is predominantly observed in the middle part of Seattle, particularly around Downtown. For reference, the map includes the locations of Seattle University and the Space Needle—one representing the author’s current location and the other being a renowned landmark in Seattle.
Queen Anne and Capitol Hill emerge with the highest crime counts, while some of their surrounding neighborhoods, including Cascade/Eastlake, Downtown, and First Hill, also rank prominently. Conversely, North Capitol Hill and Miller Park report the lowest crime incidents. However, to provide a more comprehensive understanding of neighborhood safety, factors like population density and crime rates per capita or per square mile should be taken into account. This ensures a fair and nuanced assessment of the relative safety of each neighborhood in Seattle.
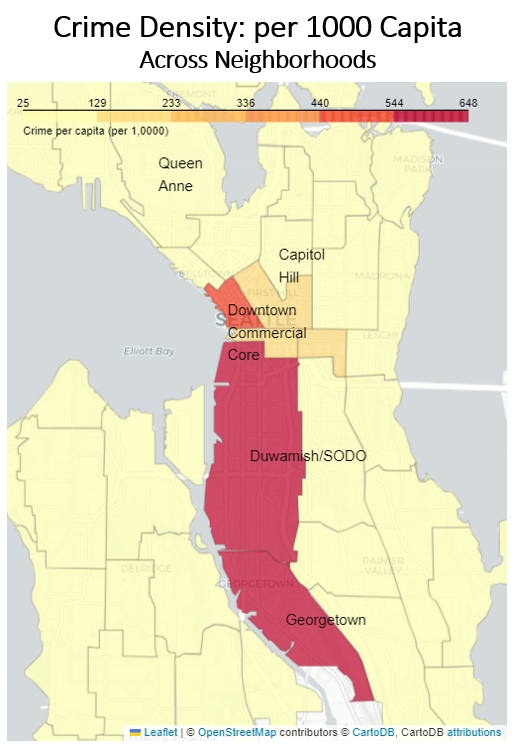
Considering demographic factors, Figure 7 evaluates crime rates per capita. Industrial areas like SODO and Georgetown exhibit the highest rates, while Downtown maintains a prominent position. Queen Anne and Capitol Hill, despite their high crime frequency, score lower in crime per capita.
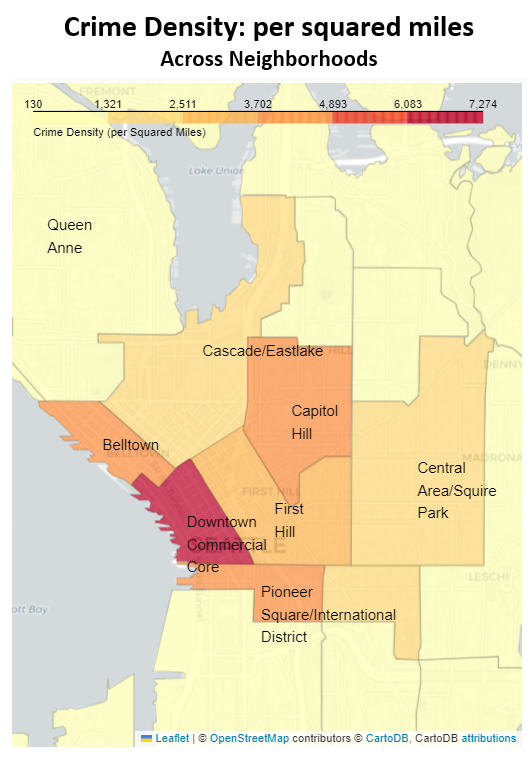
Considering crime density per square mile, Downtown, Capitol Hill, Belltown, and Pioneer Square/International District emerge as the neighborhoods with the highest crime density. Although Queen Anne has the highest crime frequency, it ranks the lowest on other metrics. In contrast, Downtown ranks highest on all three metrics—crime frequency, crime rate per capita, and crime density per square mile—making it the most vulnerable area in Seattle.
Further scrutinizing Downtown, Figure 9 highlights crime distribution within the area. 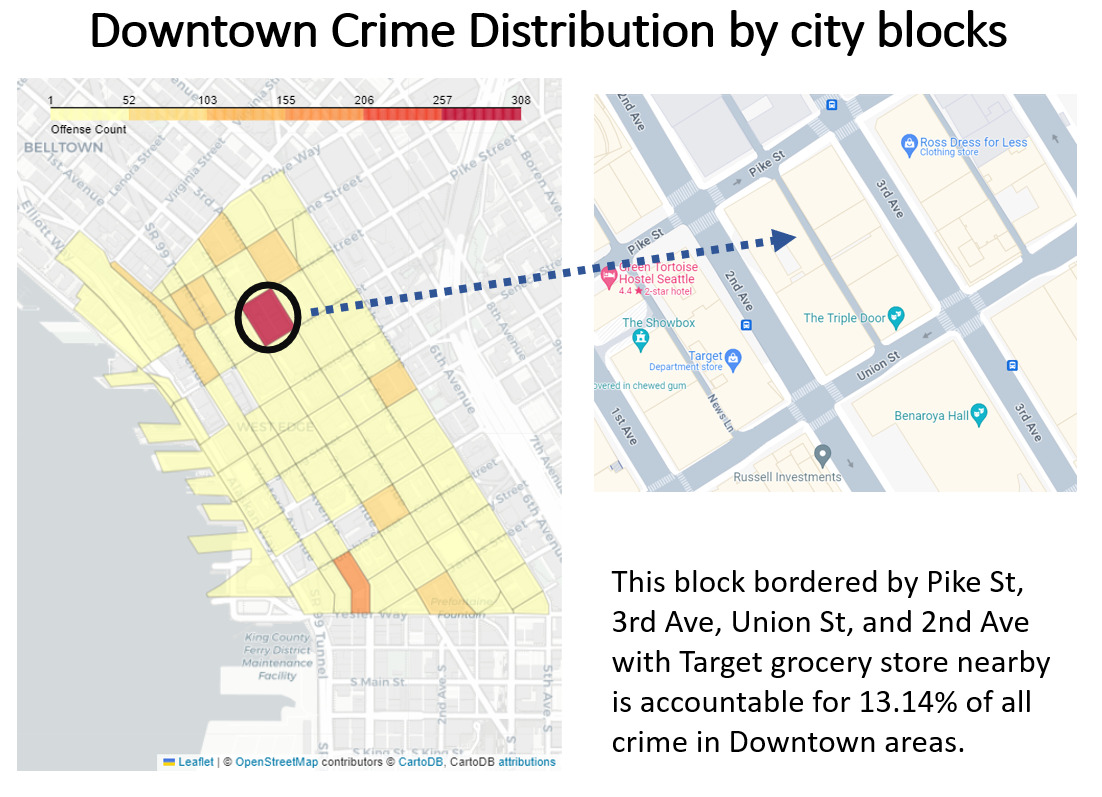
The specific block bordered by Pike St, 3rd Ave, Union St, and 2nd Ave stands out as the highest crime hotspot in Downtown Seattle. This location, accounting for 308 crime incidents in 2022, constitutes 13.14% of all incidents in the Downtown neighborhood. The intense shading of red in this area, compared to the surrounding paler areas, indicates a concentration of criminal activity. Notably, this block is surrounded by businesses like Target (a chain grocery store) and ROSS (a discount store), which may contribute to the prevalence of the highest-frequency crime, theft, in this particular zone.
Notably, theft emerges as a predominant crime across almost every neighborhood, distinguished by its non-physical nature. In contrast, the next two most frequent crimes involve physical damage. To narrow the focus to offenses with physical impact, the report explores neighborhoods with excessive assault and burglary incidents. 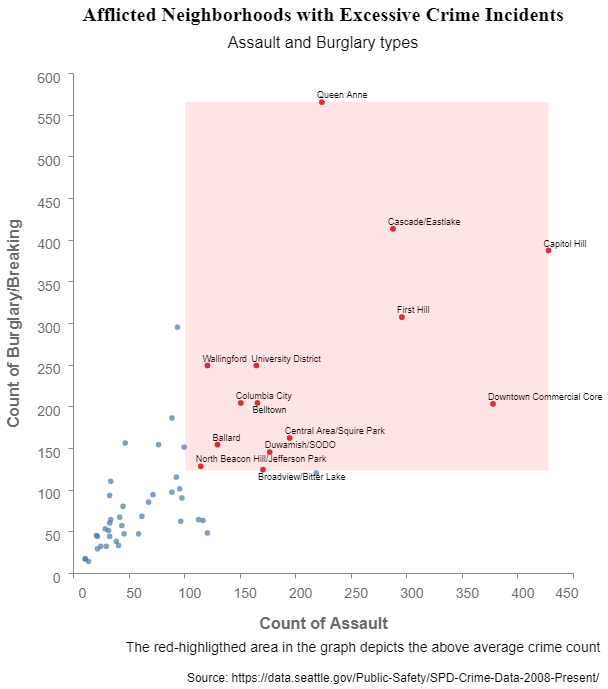
In addition to the neighborhood with the highest crime rate, the analysis highlights other areas such as University District (University of Washington campus), Belltown, and Columbia City. There appears to be a positive correlation between assault and burglary in these neighborhoods. Capitol Hill stands out as the peak of this trend, indicating a higher incidence of both assault and burglary. On the other hand, Queen Anne shows a comparatively higher rate of burglary with a lower assault rate, while Downtown exhibits the opposite pattern, emphasizing the diverse crime dynamics across Seattle neighborhoods.
Conclusions
In summary, the comprehensive analysis of Seattle’s crime trends from 2008 to 2022 has provided valuable insights into the city’s public safety landscape. A general upward trend in crime rates was observed over the years, with larceny/theft, burglary, and assault being predominant. Specific areas, such as Queen Anne and Capitol Hill, showed higher incidences of assault and burglary, signaling the need for targeted interventions in these regions.
The geographical distribution and density analysis unveiled variations, with some neighborhoods having high crime counts and others exhibiting higher crime rates per capita or per square mile. The correlation between population density and crime count emphasizes the challenges faced by more densely populated areas. Downtown consistently ranks highest in all metrics. This showcases the needs for more resources in higher densed communities.
The multi-level geographical analysis revealed intricate micro-level patterns of crime within Seattle. Although Downtown exhibited the highest overall crime rate among neighborhoods, a closer examination identified specific blocks with a concentration of criminal incidents. This nuanced understanding underscores the importance of exploring finer geographic units, such as individual blocks, to capture localized variations in crime distribution.
In conclusion, this analysis underscores the significance of adopting a multifaceted approach to comprehend and address crime in Seattle. Emphasizing the importance of understanding crime localization at the micro-level, the insights from this analysis can prove valuable for law enforcement and public works in optimizing resource allocation and enhancing outreach efforts. By delving into the nuances of crime dynamics in different neighborhoods, authorities can tailor interventions to specific needs, fostering more effective strategies for promoting public safety and well-being.
Future impovements
Moving forward, implementing statistical models like Kernel Density Estimation (KDE) can enhance our analysis by creating a heatmap of crime throughout Seattle. This approach will provide a more sophisticated and nuanced representation of crime distribution, making it valuable for law enforcement planning and public considerations, especially concerning accommodations. Currently, our comparison of crime counts between areas lacks statistical support, and KDE will bridge this gap by offering a data-driven visualization that can uncover subtle patterns and variations in crime density across the city.
References:
Seattle Police Department Crime Data: https://data.seattle.gov/Public-Safety/SPD-Crime-Data-2008-Present/tazs-3rd5
Seattle Demogrphic Data: https://data-seattlecitygis.opendata.arcgis.com/datasets/SeattleCityGIS::selected-demographic-and-housing-estimates-dp05/explore
Seattle Community Areas Geospatial data: https://data-seattlecitygis.opendata.arcgis.com/datasets/SeattleCityGIS::community-reporting-areas-3/about
Seattle Census Block data: https://data.seattle.gov/dataset/2020-Census-Blocks-Seattle/rg9f-z788/data
Author note:
In the context of my Master of Data Science program at Seattle University, this project represents a collaborative effort for my Data Visualization class. In the public-facing iteration of this report, my emphasis shifts towards seamless narratives and effective storytelling, deviating from the original focus on visualization components and design choices.
My specific contribution to this report lies in executing a multi-level geospatial analysis. The process commences with geoprocessing multiple geometry types, aiming to unveil crime patterns across multiple zoning areas. Additionally, it ensures the precise integration of demographic details, including population and land areas, thereby facilitating a more thorough and nuanced analysis.


